
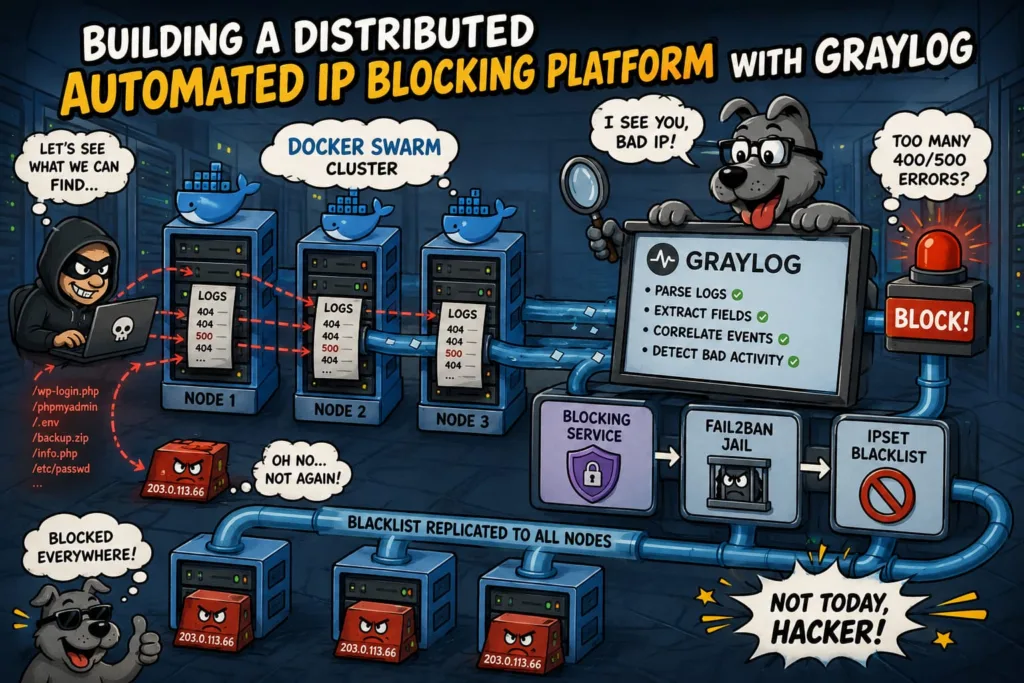
Part 1 – Detecting Web Application Reconnaissance Across a Docker Swarm
Estimated reading time: 10–12 minutes
Audience: Security Engineers, DevOps Engineers, System Administrators, SOC Analysts
Introduction
If you operate public-facing web applications, one thing quickly becomes apparent you are under constant attack.
Within minutes of deploying a new website, automated scanners begin probing it for known vulnerabilities. Some requests target outdated WordPress installations, while others search for exposed Git repositories, backup files, vulnerable PHP scripts, or recently disclosed CVEs. Most of these requests are fully automated and generated by bots continuously scanning the Internet for exploitable systems.
For many organizations, these requests are simply accepted as background noise. They are written to log files, rotated after a few days, and largely ignored. I wanted to take a different approach.
Rather than treating reconnaissance as something to observe, I wanted my infrastructure to detect suspicious behaviour in real time and provide the foundation for an automated response. The objective wasn’t to block every failed request it was to identify sustained probing activity across multiple servers and applications before an attacker found something worth exploiting.
This article is the first in a series documenting how I built a distributed IP blocking platform using Graylog, Fail2Ban, IPset and Docker Swarm.
The Problem with Traditional Blocking
Many administrators rely on tools such as Fail2Ban to protect services like SSH, mail servers, or web applications. These tools are effective when monitoring a single log file on a single server. However, my environment looked very different. I host multiple applications across several Docker Swarm nodes. Each node runs numerous containers, generating Apache, Nginx, application, and service logs independently. An attacker doesn’t care which server they’re probing. They simply scan the public endpoint. As requests are distributed across the Swarm, suspicious activity can be spread across multiple nodes.
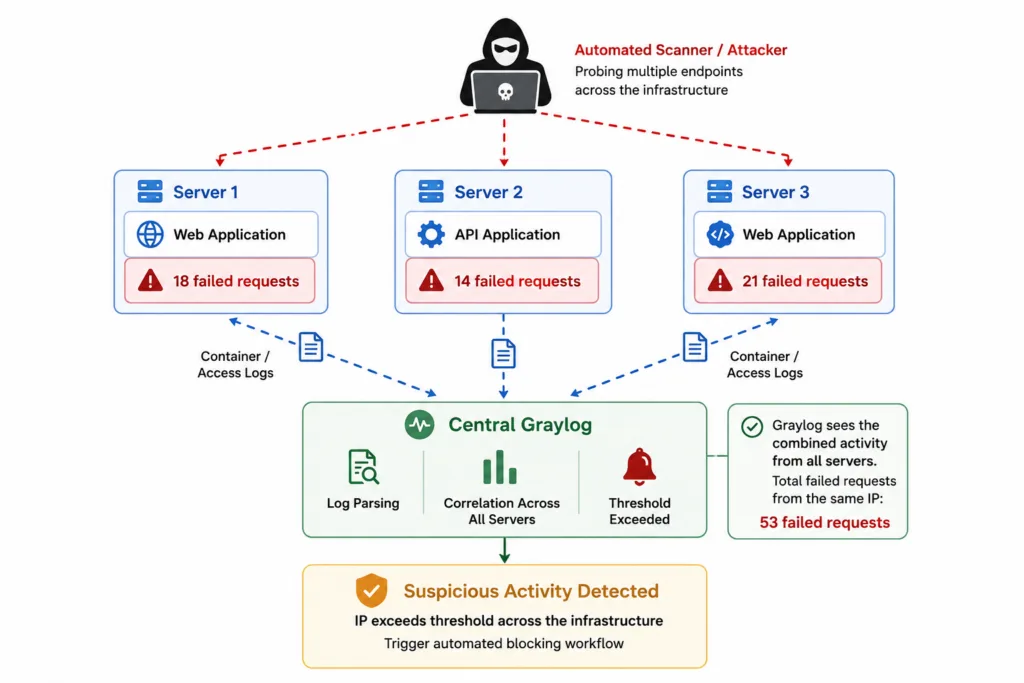
Viewed individually, none of these servers would trigger a traditional blocking mechanism. Viewed collectively, they reveal a coordinated reconnaissance attempt consisting of more than 50 failed requests from the same IP address. Traditional log monitoring cannot easily correlate this activity.
Design Goals
Before building the platform, I established a few design objectives.
The solution needed to:
- Aggregate logs from every Docker Swarm node.
- Correlate events across multiple applications.
- Detect reconnaissance rather than individual requests.
- Minimise false positives.
- Separate detection from enforcement.
- Scale as new servers and applications are added.
- Continue operating if individual nodes become unavailable.
Equally important, I wanted the blocking mechanism to remain independent from Graylog. Detection and enforcement should be loosely coupled, allowing either component to be modified without redesigning the entire system.
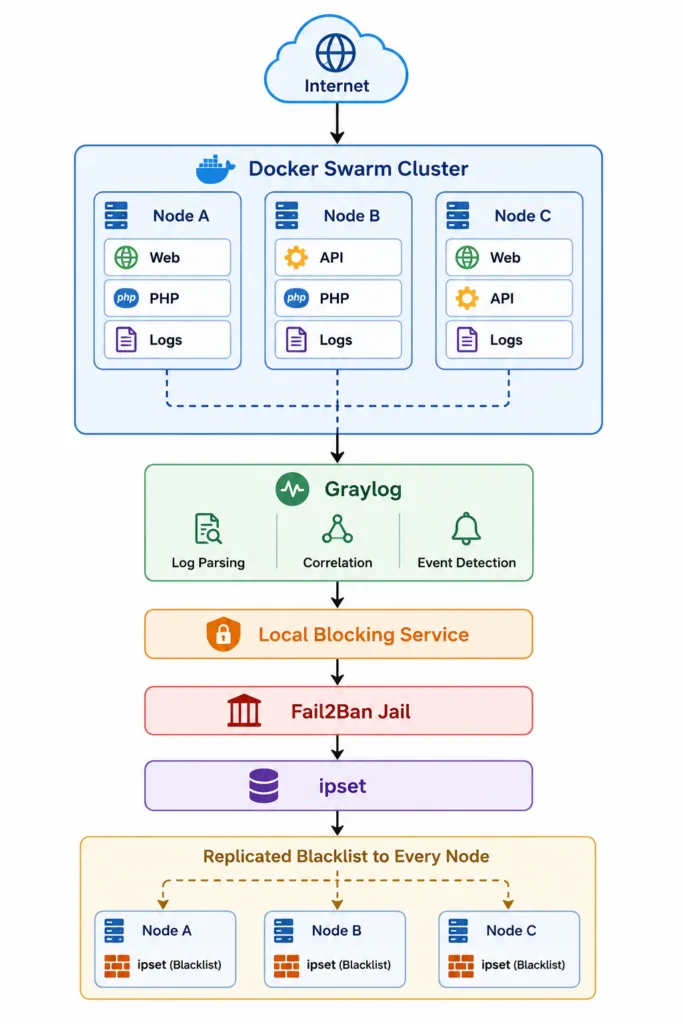
High-Level Architecture
The overall architecture follows a simple principle: Centralise visibility. Distribute enforcement.
Why Graylog?
At the centre of the platform is Graylog. Every container running within the Docker Swarm forwards its logs to a single Graylog instance. This provides a unified view of activity across the environment without requiring individual analysis on each server.
Instead of analysing raw text files, Graylog extracts structured fields including:
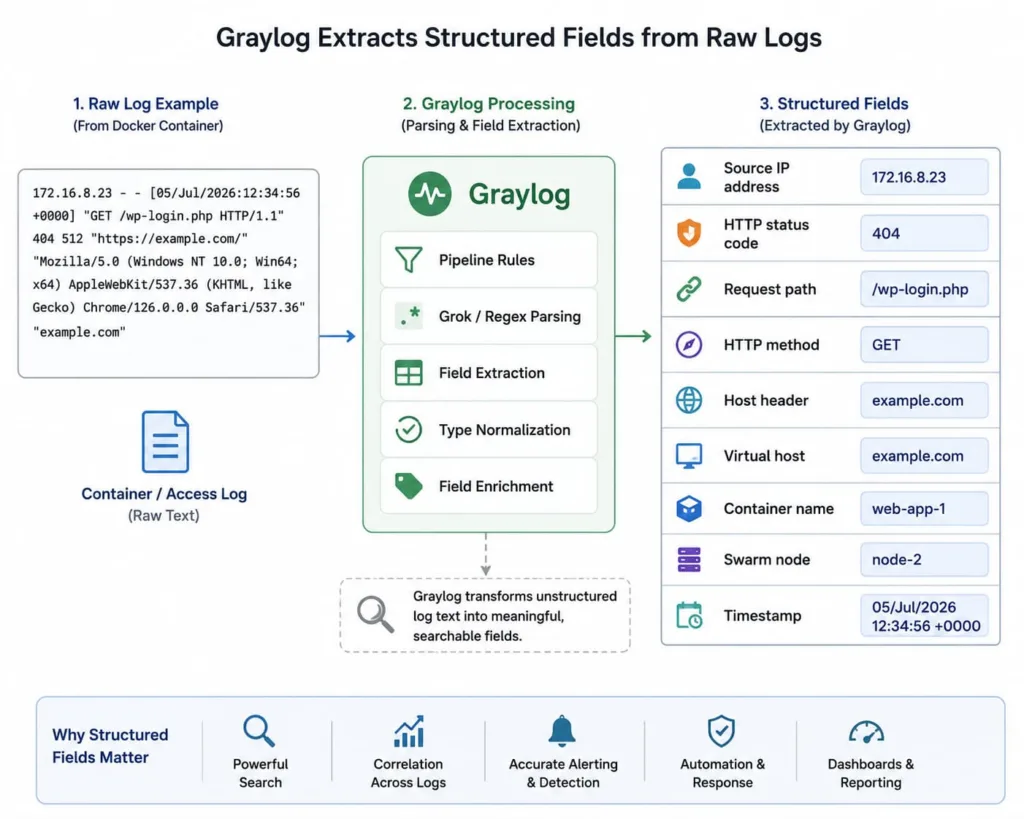
This structured data makes it possible to perform behavioural analysis rather than simple pattern matching.
For example, Graylog can answer questions such as:
- Which IP generated the most HTTP 404 responses?
- Which IP triggered errors across multiple applications?
- Which container is receiving the highest number of failed requests?
- Which IP is probing different virtual hosts within the cluster?
These are difficult questions to answer using isolated log files.
Why Monitor HTTP 400 and 500 Responses?
One of the first decisions I had to make was deciding what constituted suspicious behaviour.
Rather than matching specific attack payloads, I focused on HTTP response codes.
Repeated 4xx responses often indicate:
- Requests for non-existent resources
- Directory enumeration
- Invalid API calls
- Authentication failures
- Automated vulnerability scanning
Repeated 5xx responses may indicate:
- Unexpected application behaviour
- Triggered exceptions
- Framework edge cases
- Attempts to exploit application logic
A single HTTP 404 means very little. Fifty HTTP 404 responses targeting different endpoints within two minutes from the same IP address tells a very different story. By focusing on behaviour instead of signatures, the detection remains effective even when attackers change payloads
Behaviour Over Signatures
Rather than asking:
“Did someone request
/wp-login.php?”
I wanted to ask:
“Is this IP behaving like an automated reconnaissance tool?”
That distinction is important. Attackers constantly modify payloads. Behaviour changes far less frequently.
Typical characteristics include:
- Large numbers of failed requests
- Requests across many different URLs
- High request rate
- Multiple virtual hosts
- Invalid HTTP methods
- Requests for known vulnerable endpoints
These indicators are significantly harder to evade than simply changing a User-Agent string.
Preparing for Automated Response
An important design decision was keeping detection separate from enforcement. Graylog never modifies firewall rules directly. Instead, it identifies suspicious behaviour and generates a notification when a threshold is exceeded. A dedicated blocking service then validates the request and decides whether enforcement should occur.
This separation provides several advantages:
- Independent security controls
- Easier testing
- Reduced risk of accidental blocking
- Better auditability
- Future integration with other blocking technologies
The blocking service itself will be covered in Part 2.
What’s Next?
In this article, we’ve looked at the reasoning behind the architecture and why centralized log analysis provides a better foundation for detecting reconnaissance in a distributed environment.
In Part 2, we’ll build the detection engine inside Graylog by covering:
- Log parsing and field extraction
- Pipeline rules
- Stream design
- Event definitions
- Threshold configuration
- Correlation strategies
- Reducing false positives
- Testing the detection logic with real reconnaissance traffic
References & Further Reading
- Graylog Documentation – Official documentation covering installation, pipelines, streams, event definitions, alerts, dashboards, and APIs.
- Graylog Pipelines Documentation – Detailed guide to pipeline rules, stages, streams, field extraction, and log enrichment.
- Docker GELF Logging Driver Documentation – Explains how Docker containers can send logs directly to Graylog using the GELF logging driver.
- Graylog Docker Image Documentation – Official Docker image and deployment guidance for running Graylog in containerized environments.
Security References
These provide useful background on the concepts discussed in the article:
- OWASP Web Security Testing Guide (WSTG) – Comprehensive methodology for testing web application security.
- OWASP Top 10 – The most common and impactful web application security risks.
- MITRE ATT&CK Framework – Knowledge base of adversary tactics and techniques, including reconnaissance and exploitation.
- Fail2Ban Documentation – Official documentation for Fail2Ban configuration and jail management.
- ipset Manual Page – Official documentation for efficient Linux IP set management.
- Netfilter / iptables Project – Official project for Linux packet filtering and firewalling.
Series Index
- Part 1: Detecting Web Application Reconnaissance Across a Docker Swarm (this article)
- Part 2: Building the Graylog Detection Engine
- Part 3: Designing the Blocking Service API
- Part 4: Automated Enforcement with Fail2Ban and ipset
- Part 5: Replicating Blacklists Across Docker Swarm Nodes
- Part 6: Measuring Effectiveness and Operational Lessons
Custom Security Solutions for Your Infrastructure
Every IT environment has different requirements for monitoring, threat detection, and automated response. We develop tailored security solutions aligned with your infrastructure, applications, and operational processes—from centralized log analysis and real-time monitoring to automated blocking mechanisms.
Would you like to better protect your systems against automated attacks and other threats? Contact us for a no-obligation consultation.